




U.S. Dentists Database 2.0.0: Three Tables, Clearer Provider Data
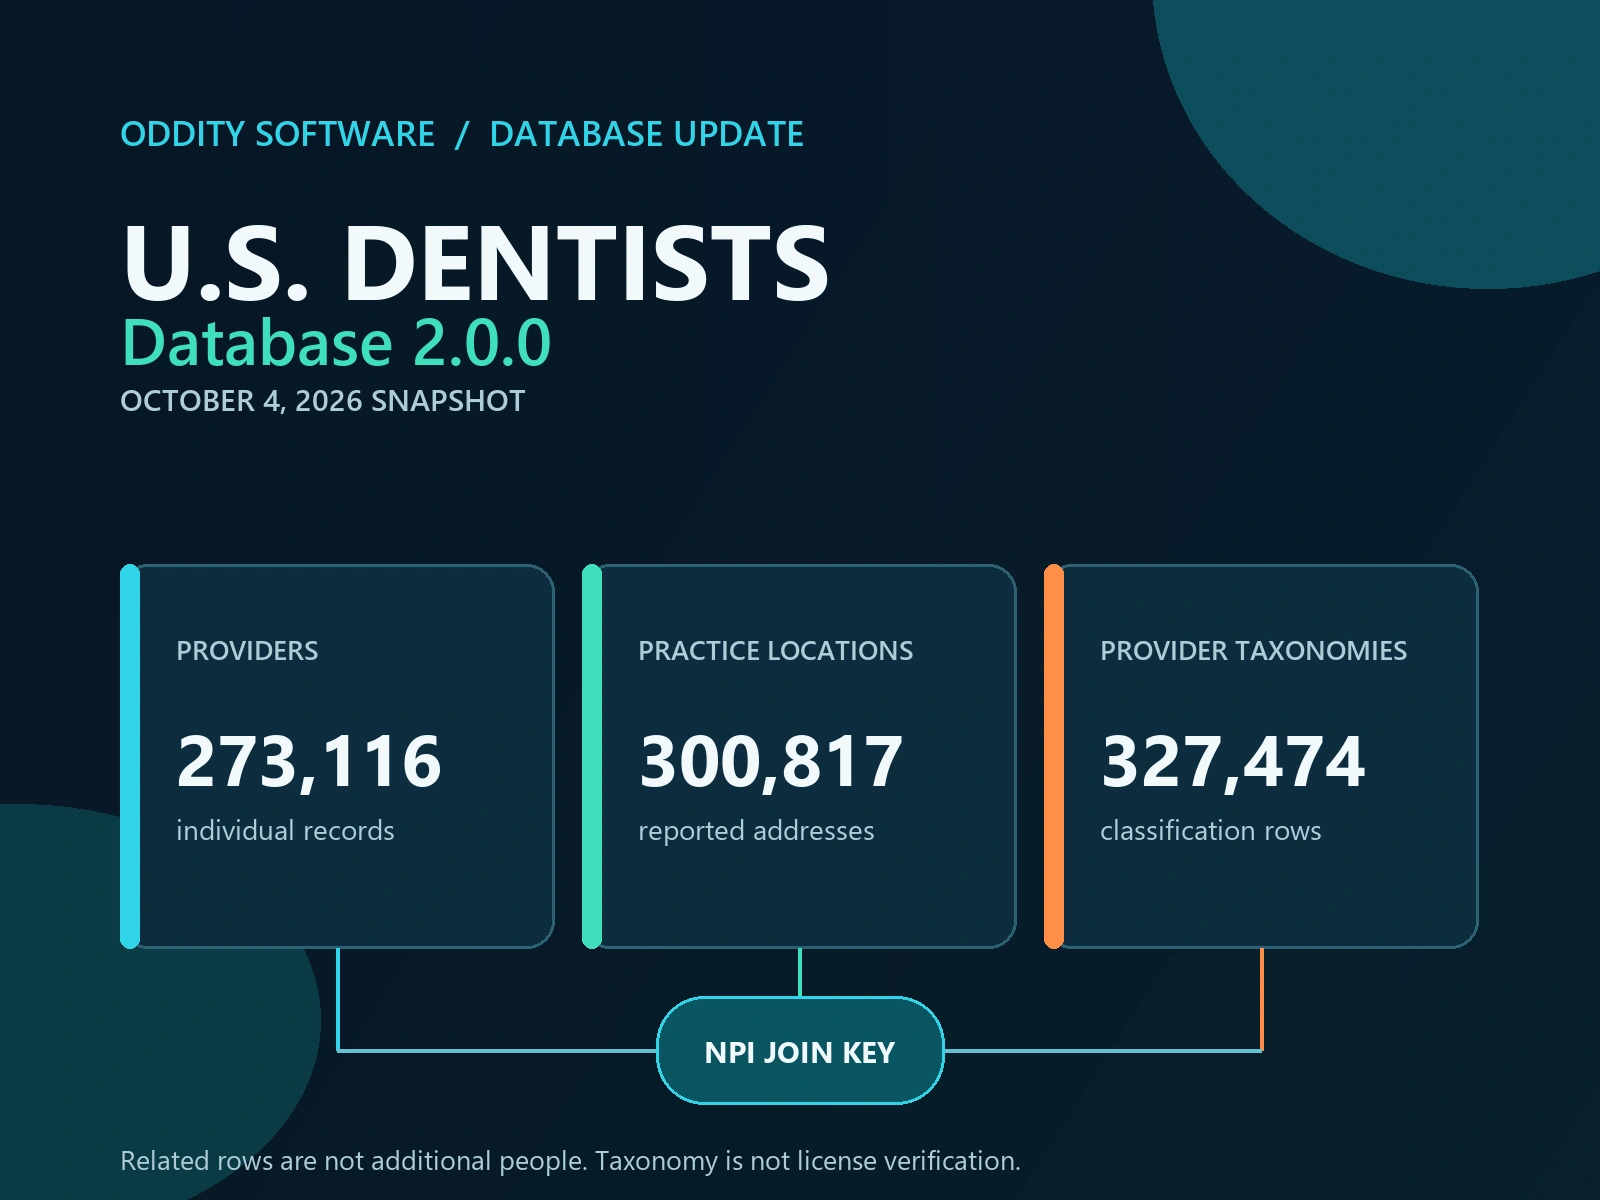
The updated U.S. Dentists Database is now available as version 2.0.0. This release contains 273,116 dentist provider records, 300,817 practice-location rows, and 327,474 provider-taxonomy rows. The figures describe three different kinds of information, so they should be read separately. Together, they make up 901,407 rows across the release's three tables. That total is a count of table rows, not a count of individual dentists.
The release has an October 4, 2026 data cutoff. The public product page identifies the included tables, their fields, table-level counts, column profiles, and sample data. Buyers can review those details before choosing a license or building a workflow. The update is a point-in-time reference assembled from the published NPI source records and a defined dentist-taxonomy mapping. It is not a real-time feed, a directory of every person who practices dentistry, or an independent review of professional credentials.
Three tables, three units of information
The provider table holds the individual dentist records. Its 273,116 rows represent the selected provider population for this release. A provider row is the natural place to begin when an analyst needs an individual-level reference file. It is also the table that should be counted when the question is how many provider records the release contains.
The practice_locations table contains 300,817 rows of practice-location information. Location rows describe reported practice addresses associated with the selected providers. A provider can be connected to an address, but a location is not another dentist. The location total can therefore be larger than the provider total without indicating that the same person has been counted twice in the provider table. Users who need to study geography, group nearby practices, or review addresses should work with this table and the documented relationship to provider records.
The provider_taxonomies table contains 327,474 rows that preserve reported taxonomy entries. These rows capture classification information attached to NPI records. They are not additional people, practice sites, or a direct measure of the number of active dental licenses. A provider may have more than one taxonomy entry, and taxonomy position and primary designation are distinct pieces of information. Keeping the rows in their own table lets a user inspect the classifications without flattening them into duplicate provider records.
Why the counts stay separate
A single headline number can hide how a multi-table dataset is structured. Counting every row as a person would overstate the provider population because location and taxonomy rows have different roles. Counting only providers would hide the number of associated address and classification records. Version 2.0.0 reports these totals separately so that a user can choose the measure that matches a question.
This distinction matters when joining tables. A join from one provider to several taxonomy entries can create multiple output rows for the same provider. A join to more than one location can do the same. That is a normal consequence of one-to-many relationships, not necessarily a data error. If a report is intended to count dentists, count unique provider identifiers at the provider level after applying the needed filters. If it is intended to count addresses or taxonomy assignments, count the relevant table's rows and label that unit clearly.
The sales page provides the field list and column profile for each table. The Distinct and Missing values help users understand the values present in a particular column. They do not promise that every field is complete, unique, or appropriate for every analysis. Review the field-level values and sample rows before deciding which columns belong in a production workflow. A sample illustrates the shape of the file, not the full distribution of every value.
A defined snapshot and selection rule
The release uses an October 4, 2026 cutoff. Its provider population is based on individual Type 1 NPI records classified through the documented NUCC taxonomy mapping for dentists. Providers are selected when a qualifying dentist code is present in any taxonomy slot, while the source's taxonomy entries and primary indicator remain available as separate data. The inclusion rule is designed to preserve the source's classification structure rather than silently treating the first taxonomy slot as the only relevant one.
The release also applies the documented status and location rules for the cutoff. Status fields are interpreted using the latest relevant deactivation and reactivation sequence, and the included location population is limited to the specified United States coverage. These rules make the dataset reproducible as a dated snapshot. They do not turn the source into a live registry or eliminate the possibility that a record will change after the cutoff.
The source describes NPI records and reported information. Inclusion in this database does not independently verify a person's identity, current employment, office affiliation, specialty, or professional standing. In particular, taxonomy is not a state license lookup. A taxonomy code can help identify how an NPI record is classified, but it should not be presented as proof that a person holds a current license or is accepting patients.
Choosing a useful workflow
A researcher studying the distribution of individual provider records can start with the provider table and then add only the fields needed for the question. An organization comparing reported practice geography can use the location table, taking care to describe address rows as reported locations rather than unique businesses or offices verified on the ground. An analyst grouping providers by classification can use provider_taxonomies, retain the provider identifier, and decide whether the analysis should include every qualifying taxonomy entry or only a specified taxonomy position.
A combined workflow can connect the tables through their documented identifiers. Before producing summaries, choose the entity being counted, decide how to handle multiple relationships, and test the join on a small sample. For example, a report about provider totals should not count each joined row as a separate person. A report about taxonomy assignments should not label assignment rows as dentists. These basic choices make an otherwise correct extract much easier to interpret.
The downloadable files are intended for research, reference, analysis, and the other uses allowed by the license selected at purchase. A buyer should read the current agreement and tier description on the product page before use, especially when the project involves redistribution, publication, or incorporation into another product. The listed current prices are $75 for Usage, $150 for Publication, and $300 for Master. An eligible customer with prior Master rights can review the current-version update offer of $18.75. The applicable written agreement controls the actual rights; a price or tier name alone does not replace that agreement.
Using contact and location fields thoughtfully
Provider and practice information can be useful for matching, reference, and analysis, but the presence of a contact field does not establish permission to contact a person. Users should consider their own legal, contractual, and internal requirements before using any personal or business contact information. The database is not a substitute for consent records, suppression lists, compliance review, or a current verification process.
Addresses and other source-reported details can become outdated. Before using them for an operational decision, compare the record with an appropriate current source and retain the date of that check. If a downstream system stores a location as a verified branch, an active office, or a staffed practice, that label should be supported by evidence outside the mere presence of a row in this file.
The distinction between source fields and interpreted fields is also important. A user may choose to derive a market segment, geographic region, or specialty grouping from the supplied data. Those derived values should remain clearly separated from values provided in the source. Keeping both the original fields and the transformation rules makes the work easier to audit and revise when a classification standard or source record changes.
What to review before downloading
Start with the public schema and the three table counts. Confirm that the fields support the intended task, and review the column profiles for fields that drive matching, grouping, or filtering. Use the sample rows to understand formatting, but do not use a handful of examples to estimate full-release uniqueness or missingness. The statistics are calculated for the full release and are shown table by table.
Then check the license details that match the intended use. Usage, Publication, and Master are separate options with separate agreements. If the project relies on an existing Master entitlement, review the update offer and the account's available access through the normal Oddity customer portal. The prior version is preserved as historical release evidence; the current public download is version 2.0.0. The exact files and allowed use depend on the purchased or otherwise valid entitlement.
The DB22 product page also links to the current Help articles for coverage and records, joining and importing, and rights and downloads. Those guides explain the practical details alongside the sales-page schema. Together, the product page and Help pages provide a path from first review through file handling without requiring a user to infer table meaning from a record count alone.
A clearer way to read the release
Version 2.0.0 is organized around a straightforward idea: provider records, practice locations, and taxonomy entries answer different questions. Keeping them separate makes it possible to use the provider population without losing the source's location and classification detail. It also makes the counts easier to understand and the joins easier to explain.
For a quick orientation, remember the three units: 273,116 provider rows, 300,817 practice-location rows, and 327,474 taxonomy rows. The complete 901,407-row sum is useful as a description of total table volume, but it is not a dentist count. The cutoff is October 4, 2026. The NPI and taxonomy information is reported-source data, not an independent licensure check and not evidence of contact consent.
Review the full field list, table profiles, sample data, Help guides, and current license agreement before building a workflow. That care helps keep a provider count a provider count, an address count an address count, and a classification reference in its proper context.
Start a useful discussion below. Your contribution will appear after staff review.